

A measure of spread, sometimes also called a measure of dispersion, is used to describe the variability in a sample or population.
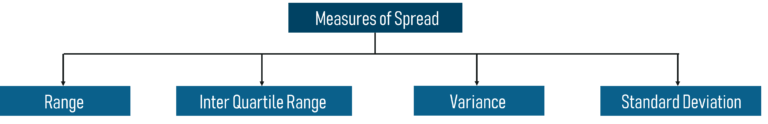
Just like the measure of central tendency , we also have measures of the spread, which comprises of the following measures:
Range: It is the given measure of how spread apart the values in a data set are. The range can be calculated as -
      Range = Max(x_i) - Min(x_i)

      Here,

      Max(x_𝑖): Maximum value of x

      Min(x_𝑖):  Minimum value of x
Quartile: Quartiles tell us about the spread of a data set by breaking the data set into quarters.To better understand how quartile and the IQR are calculated, let’s look at an example.
Consider a list containing Marks of students in a class-
Marks=[10,11,12,15,17,18,19,20,22,23,24,25]
The quartiles lie in the following ranges:
The first quartile (Q1) lies between the 3rd and 4th observation.
The second quartile (Q2) lies between the 6th and 7th observation.
The third quartile (Q3) lies between the 9th and 10th observation.
- Inter Quartile Range (IQR): It is the measure of variability, based on dividing a data set into quartiles. The interquartile range can be calculated as
IQR = Q3 – Q1
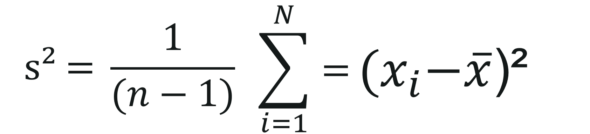
Variance: It describes how much a random variable differs from its expected value.Variance can be calculated by using the below formula:
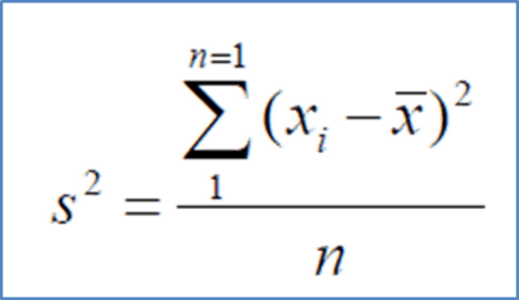
Here,
x: Individual data points n: Total number of data points x̅: Mean of data points
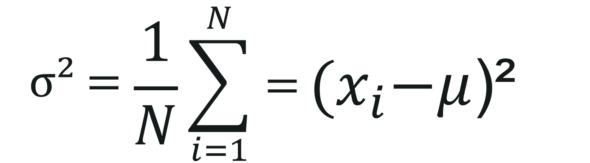
Deviation is the difference between each element from the mean. It can be calculated by using the below formula:
Deviation = (𝑥_𝑖 – µ)
- Population Variance is the average of squared deviations. It can be calculated by using the below formula:
- Sample Variance is the average of squared differences from the mean. It can be calculated by using the below formula:
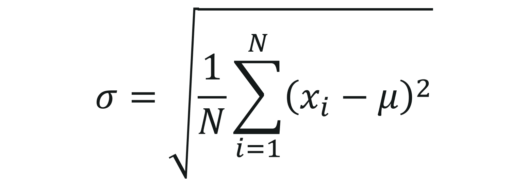
- Standard Deviation: It is the measure of the dispersion of a set of data from its mean. It can be calculated by using the below formula:
To better understand how the Measures of spread are calculated, will look at a use case in the upcoming blogs.
Thanks for Reading!! Happy Learning!!